使用 torch.compile 進行效能分析#
建立日期:2023年6月6日 | 最後更新日期:2025年7月11日
torch.profiler 的用途:#
torch.profiler 有助於以核心級別的粒度來理解程式的效能——例如,它可以顯示圖中斷和資源利用率。分析器提供的資料通常可以幫助使用者瞭解在哪裡進一步調查以理解模型效能。
要了解核心級別的效能,還可以使用其他工具,例如 Nvidia Nsight compute tool、AMD Omnitrace、Intel® VTune™ Profiler 或 Inductor 的分析工具。
另請參閱 通用的 PyTorch 分析器指南。
使用 torch.profiler 和檢視 trace 的基礎知識#
示例程式:我們將使用這個 profiling resnet18 的示例。請注意此示例程式的以下部分:
包含一個預熱執行,以等待編譯完成(這將預熱 CUDA 快取分配器等系統)
使用
torch.profiler.profile()上下文來分析我們感興趣的部分使用
prof.export_chrome_trace("trace.json")匯出分析偽影。
    import torch
    from torchvision.models import resnet18

    device = 'cuda'      # or 'cpu', 'xpu', etc.
    model = resnet18().to(device)

    inputs = [torch.randn((5, 3, 224, 224), device=device) for _ in range(10)]

    model_c = torch.compile(model)

    def fwd_bwd(inp):
        out = model_c(inp)
        out.sum().backward()

    # warm up
    fwd_bwd(inputs[0])

    with torch.profiler.profile() as prof:
        for i in range(1, 4):
            fwd_bwd(inputs[i])
            prof.step()

    prof.export_chrome_trace("trace.json")
檢視 Chrome trace:在 Chrome 瀏覽器中,開啟 chrome://tracing 並載入 json 檔案。使用“w”和“s”鍵放大和縮小,使用“a”和“d”鍵向左和向右滾動。“?”會顯示一個包含快捷鍵列表的“幫助”螢幕。
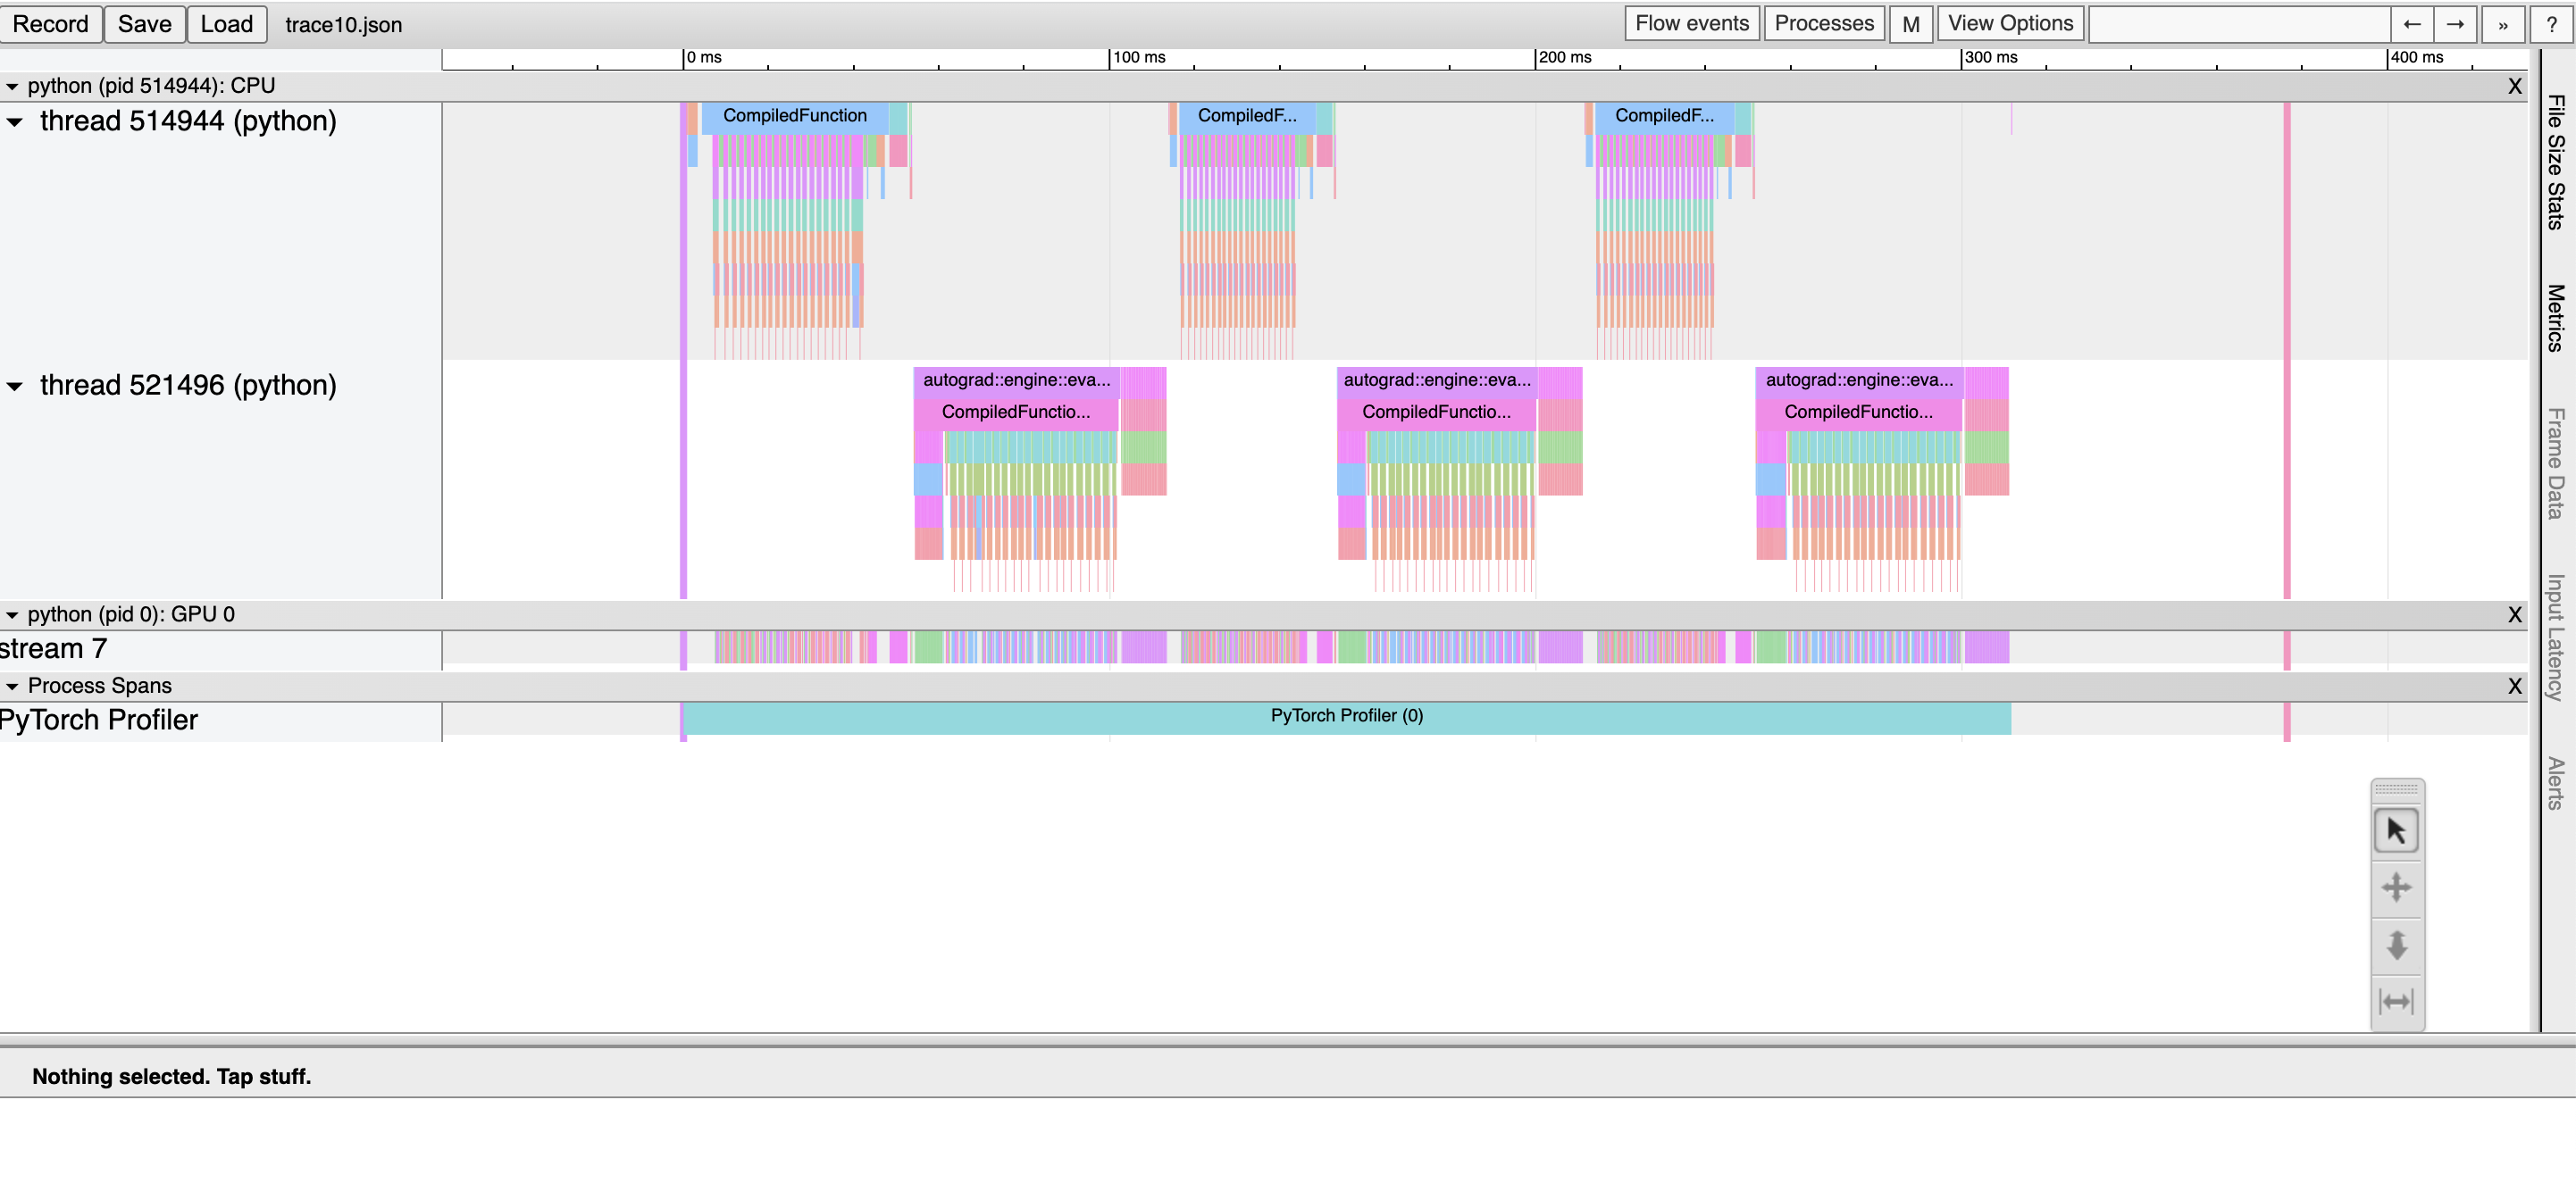
在這裡,我們觀察到:
CompiledFunction 和 CompiledFunctionBackward 事件,它們對應於 dynamo 編譯的區域。
頂部的 CPU 事件,底部的 GPU 事件。
CPU 和加速器事件之間的流。
加速器上的每個核心都在 CPU 上執行的程式碼啟動後執行。分析器可以在加速器和 CPU 事件之間繪製連線(即“流”),以顯示哪個 CPU 事件啟動了加速器核心。這特別有用,因為除了少數例外,加速器核心是非同步啟動的。
要檢視流連線,請點選 GPU 核心,然後點選“ac2g”。
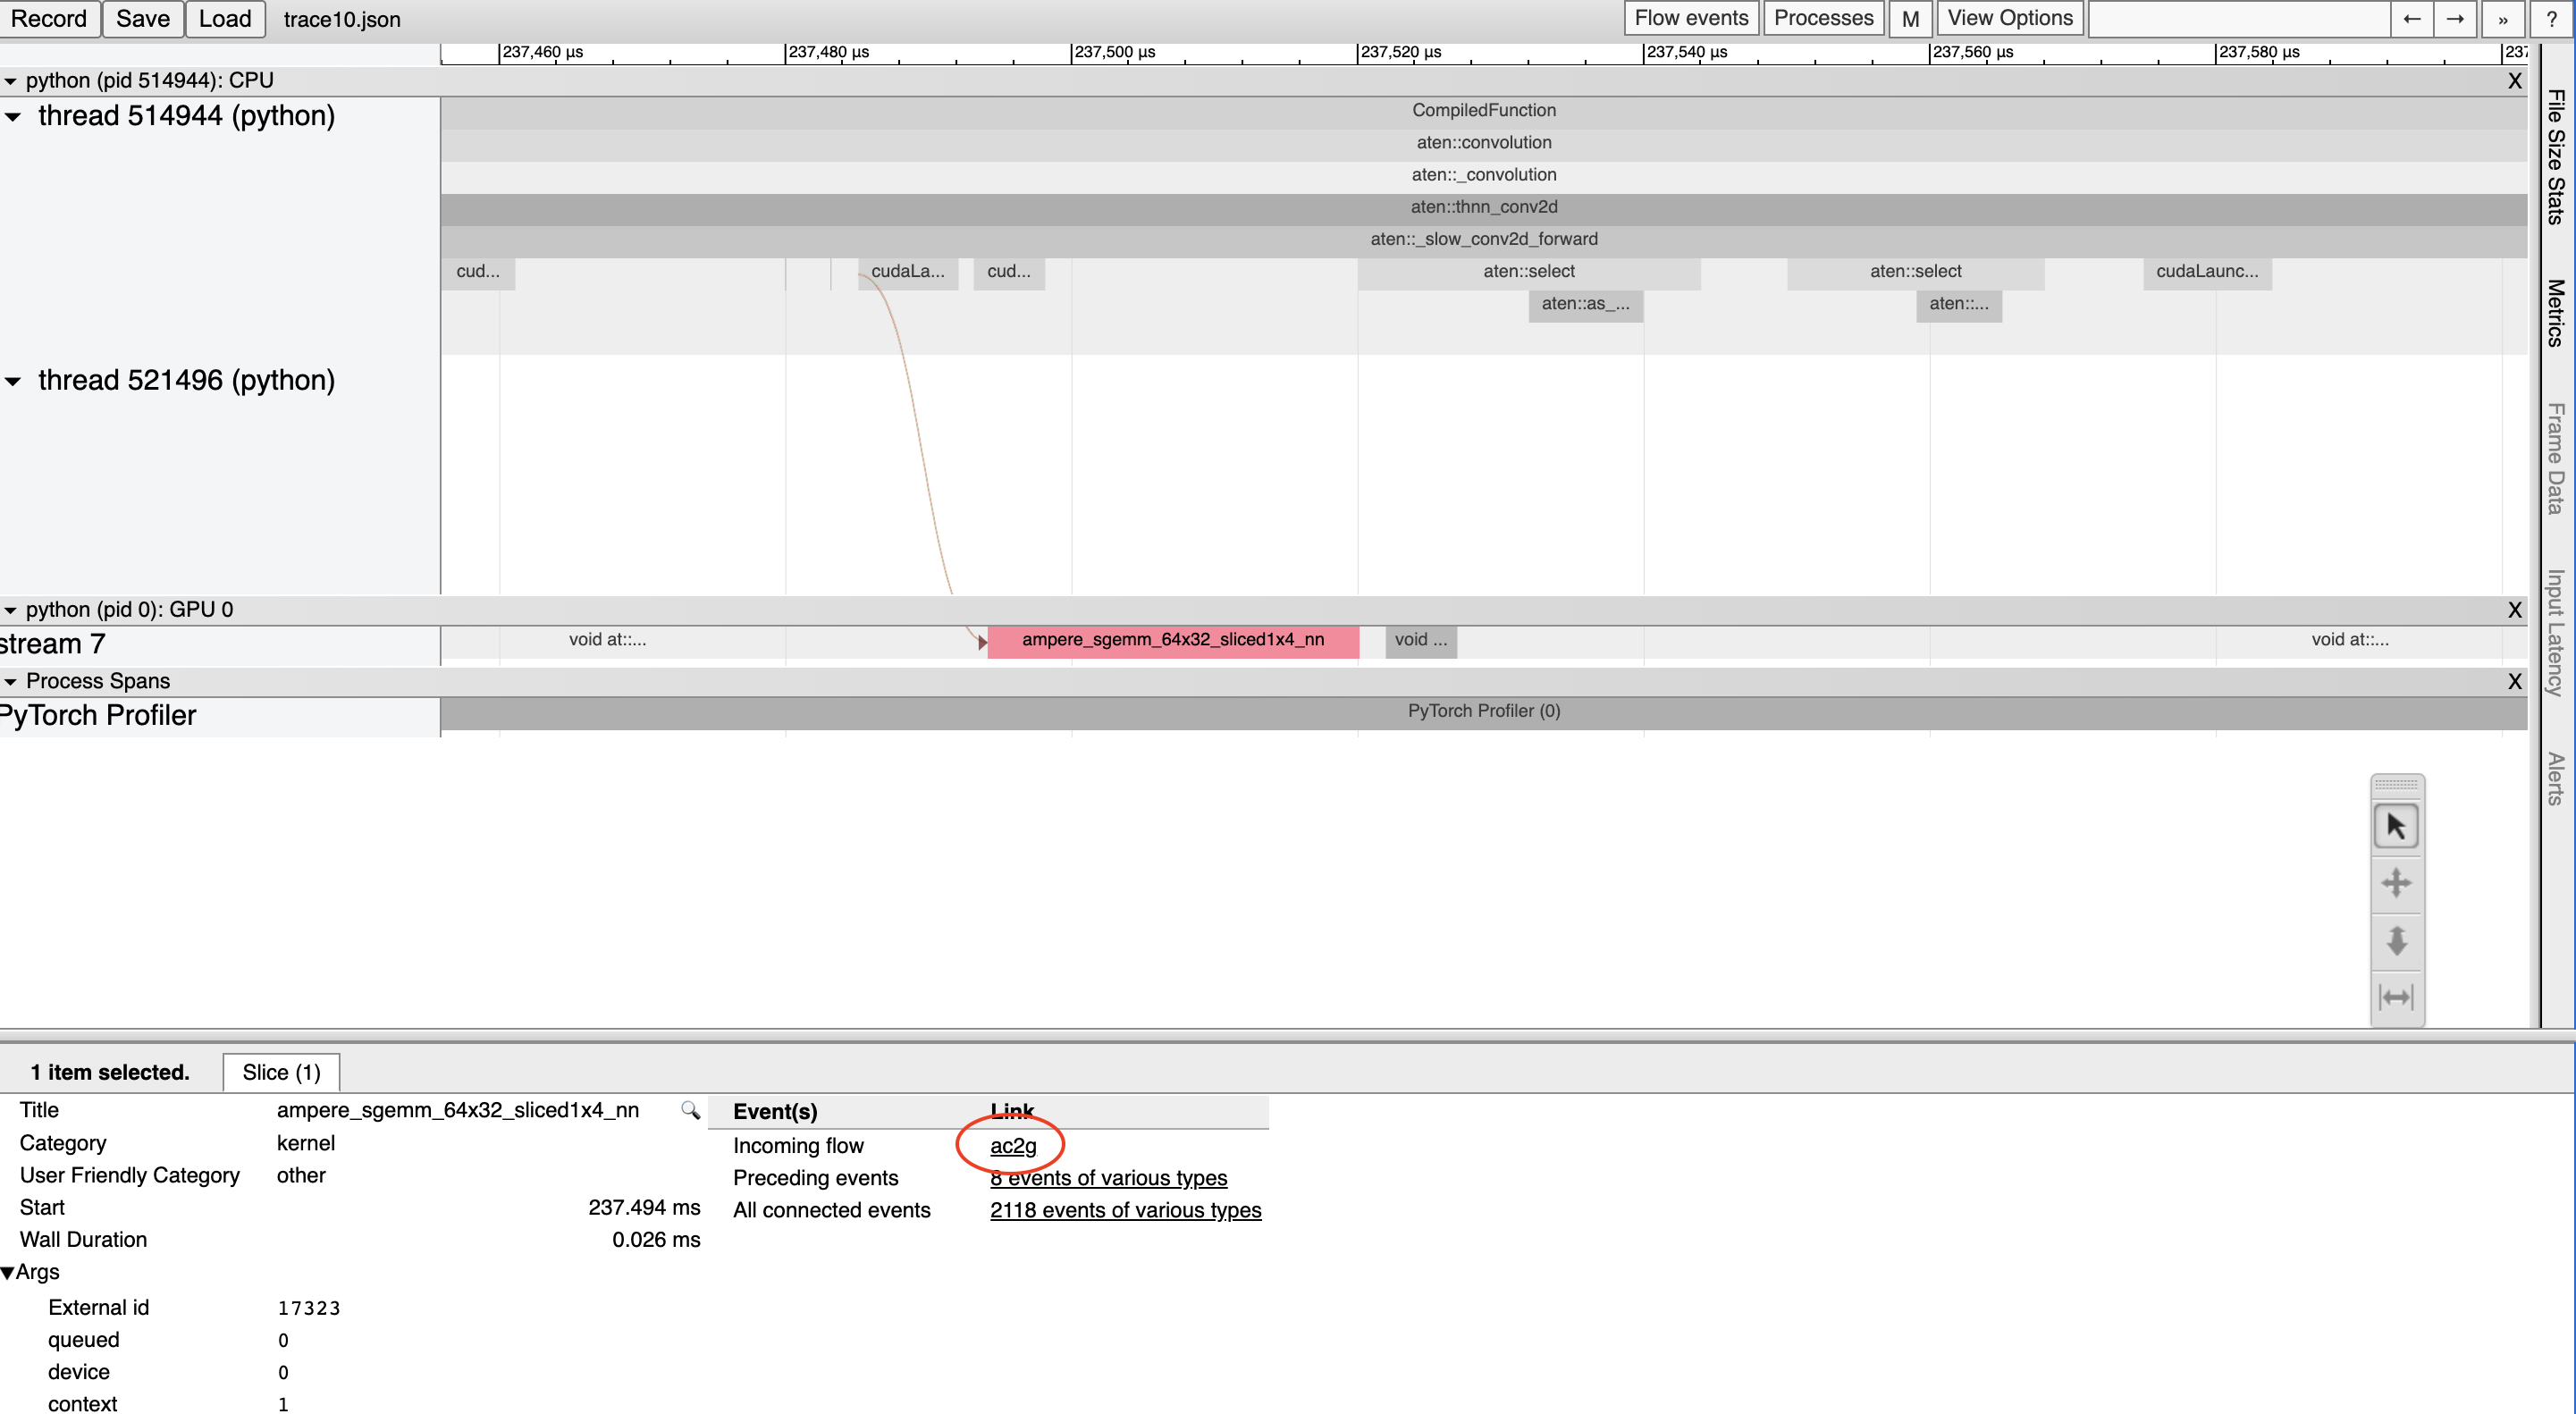
或者,透過頂部的“Flow events”下拉選單開啟 *所有* 流。
解決 CUDA Graph 分析問題#
當啟用 CUDA 圖時,某些 CUDA 配置(驅動程式版本低於 525.85.12 或 CUDA < 12)可能會遇到分析工具和 CUDA 圖之間的相容性問題。要解決這些問題,請在程式頂部新增一個空的分析上下文。
    import torch

    torch.profiler._utils._init_for_cuda_graphs()

    # ... rest of program
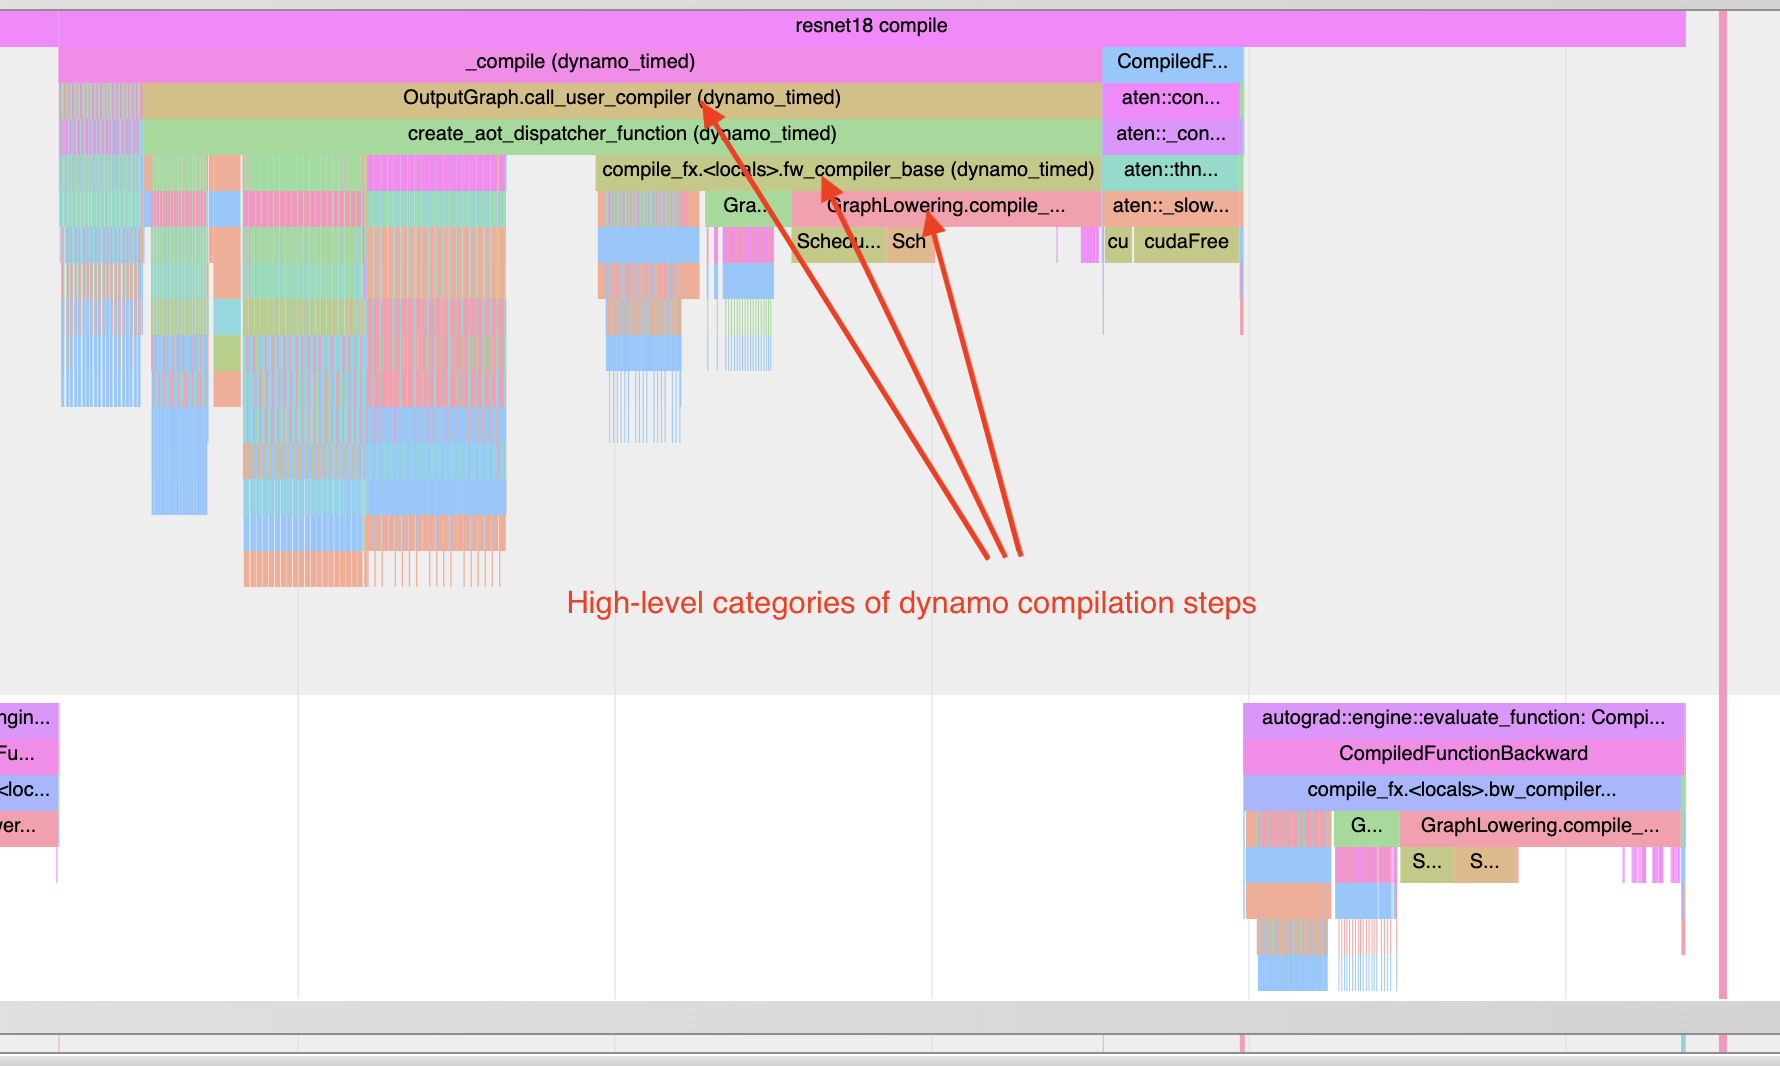
理解編譯時間#
要了解編譯為何耗時過長,可以分析 `torch.compile` 程式的第一次呼叫。請記住,對編譯的分析 trace 可能比典型分析更易失真,因為編譯工作負載可能與典型的 PyTorch 工作負載非常不同。在某些情況下,trace 檔案也可能非常大。大於 1GB 的 trace 檔案可能難以使用 chrome tracing 工具開啟。
注意:使用 :code:torch._dynamo.utils.compile_times() 也可以在非圖形化格式下獲得大致相同的資訊。此實用程式不會顯示編譯步驟發生的時間,但會顯示每個步驟花費的時間——並且時間不會受到任何分析開銷的影響。
下面看一個例子
    import torch
    from torchvision.models import resnet18

    # user can switch between cuda and xpu
    device = 'cuda'
    model = resnet18().to(device)
    inputs = [torch.randn((5, 3, 224, 224), device=device) for _ in range(10)]

    model_c = torch.compile(model)

    def fwd_bwd(inp):
        out = model_c(inp)
        out.sum().backward()

    def warmup_compile():
        def fn(x):
            return x.sin().relu()

        x = torch.rand((2, 2), device=device, requires_grad=True)
        fn_c = torch.compile(fn)
        out = fn_c(x)
        out.sum().backward()

    with torch.profiler.profile() as prof:
        with torch.profiler.record_function("warmup compile"):
            warmup_compile()

        with torch.profiler.record_function("resnet18 compile"):
            fwd_bwd(inputs[0])

    prof.export_chrome_trace("trace_compile.json")
注意幾點:
第一次呼叫應該發生在分析 *期間* 以捕獲編譯。
新增預熱編譯以初始化任何需要惰性初始化的系統。
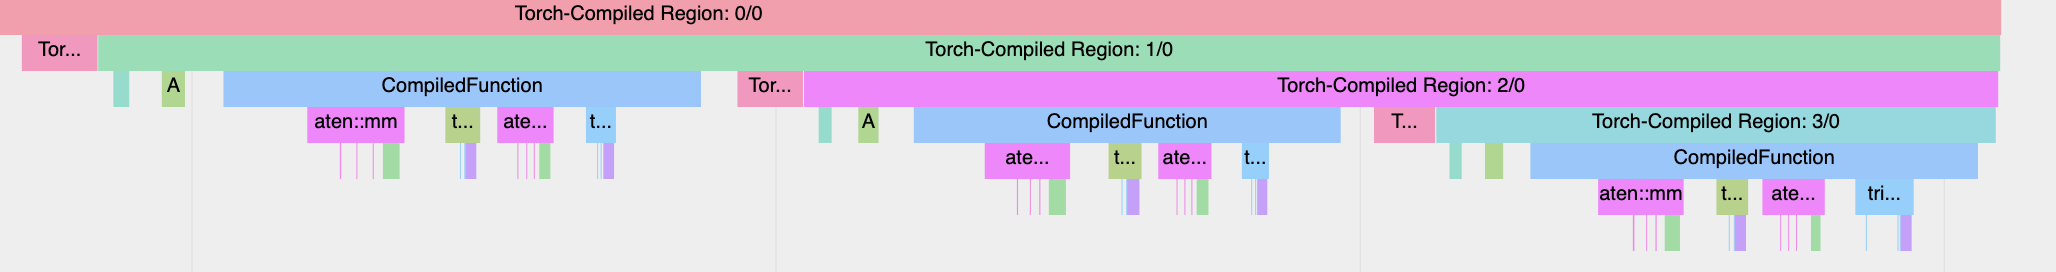
查詢圖中斷:“Torch-Compiled Region”和“CompiledFunction”#
儘管有用於識別圖中斷的日誌工具,但分析器提供了一種快速的視覺方法來識別 :ref:圖中斷 <torch.compiler_graph_breaks>。有兩個分析器事件需要關注:**Torch-Compiled Region** 和 **CompiledFunction**。
**Torch-Compiled Region** —— 該事件在 PyTorch 2.2 中引入 —— 是一個覆蓋整個編譯區域的分析器事件。圖中斷幾乎總是看起來相同:巢狀的“Torch-Compiled Region”事件。從 PyTorch 2.5 開始,分析器事件還將包含幀 ID 和幀編譯 ID。幀 ID 是幀的唯一識別符號,幀編譯 ID 表示幀已被編譯的次數。
如果您執行兩個獨立的函式,並且分別將 `torch.compile()` 應用於它們,通常應該會看到兩個相鄰(即*非*堆疊/巢狀)的 Torch-Compiled 區域。同時,如果您遇到圖中斷(或 `disable()`/跳過的區域),則會遇到巢狀的“Torch-Compiled Region”事件。
**CompiledFunction** —— 該事件在 PyTorch 2.0 中引入 —— 當對任何輸入需要梯度時出現。每次圖中斷都會打斷一個 CompiledFunction 塊,將其分成兩部分。CompiledFunction 事件僅在涉及 Autograd 時出現,即圖的輸入張量中至少有一個 `requires_grad=True`。
當 trace 中出現 CompiledFunction 事件時,它通常會與反向傳播中的 CompiledFunctionBackward 事件配對。如果呼叫了反向函式,trace 中會出現一個“fwd-bwd link”連線兩者。
如果您的用例包含一個不需要梯度的圖,並且不包含“Torch-Compiled Region”事件,那麼識別 `torch.compile` 是否正確應用可能會更加困難。一個線索是 Inductor 生成的 Triton 核心的存在。
請參閱下面的合成示例以進行演示。
    import torch
    import torch._dynamo
    # user can switch between cuda and xpu
    device = 'cuda'

    class ModelWithBreaks(torch.nn.Module):
        def __init__(self):
            super().__init__()
            def create_sequential():
                return torch.nn.Sequential(
                    torch.nn.Linear(128, 128),
                    torch.nn.ReLU(),
                    torch.nn.Linear(128, 128),
                    torch.nn.ReLU(),
                )
            self.mod1 = create_sequential()
            self.mod2 = create_sequential()
            self.mod3 = create_sequential()
            self.mod4 = create_sequential()

        def forward(self, inp):
            mod1 = self.mod1(inp)
            torch._dynamo.graph_break()
            mod2 = self.mod2(mod1)
            torch._dynamo.graph_break()
            mod3 = self.mod3(mod2)
            torch._dynamo.graph_break()
            mod4 = self.mod4(mod3)
            return mod4

    model = ModelWithBreaks().to(device)
    inputs = [torch.randn((128, 128), device=device) for _ in range(10)]

    model_c = torch.compile(model)

    def fwd_bwd(inp):
        out = model_c(inp)
        out.sum().backward()

    # warm up
    fwd_bwd(inputs[0])

    with torch.profiler.profile() as prof:
        for i in range(1, 4):
            fwd_bwd(inputs[i])
            prof.step()

    prof.export_chrome_trace("trace_break.json")
運算元核心#
當啟動一個運算元時,我們期望看到幾個事件:
CPU 端事件。
核心啟動(如果處理的是 GPU 核心)。
GPU 端事件。
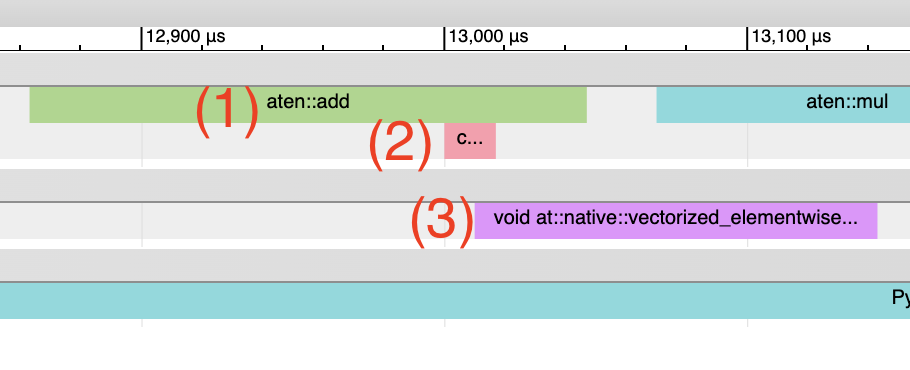
Inductor 生成的 Triton 核心。
**CPU 端事件**應顯示為以“triton_”為字首的事件。目前這些事件的資訊量很少——只有核心名稱和啟動資訊,但資訊量少於典型的 aten 核心啟動(其中包含輸入形狀、型別等)。
**核心啟動**應顯示為 `cuLaunchKernel` 而不是 `cudaLaunchKernel`(`cudaLaunchKernel` 對於 aten op 是典型的)。
**GPU 端事件**應顯示出來,其名稱的描述性程度取決於 `unique_kernel_names` 的 Inductor 配置。
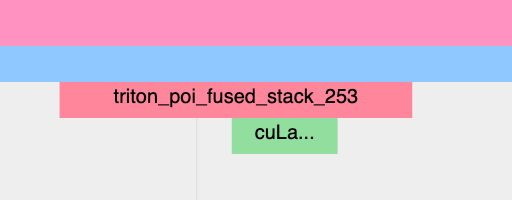
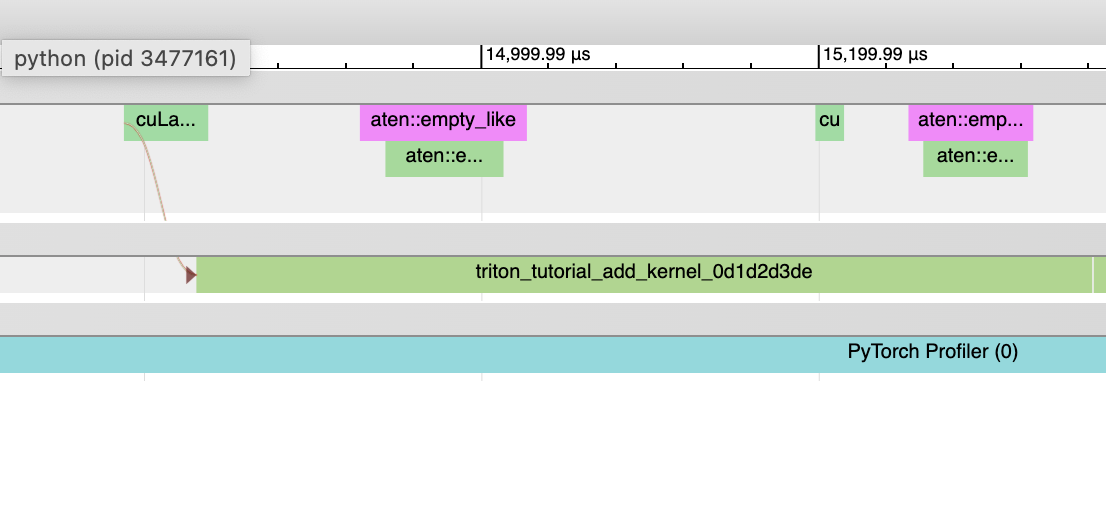
非 Inductor 生成的 Triton 核心。
**CPU 端**事件可能不會出現在 trace 中;自動插入分析器事件的機制目前在 Inductor 層面實現,因此繞過 Inductor 的 Triton 核心可能不會出現在 trace 中,除非使用者手動進行了註解。
**核心啟動**應顯示為 `cuLaunchKernel` 而不是 `cudaLaunchKernel`(`cudaLaunchKernel` 對於 aten op 是典型的)。
**GPU 端**事件應顯示出來,其名稱與編寫的 triton 核心類似。
Inductor 生成的 CPU 核心。
**CPU 端事件**不會出現在 trace 中;我們尚未為此新增分析。
**核心啟動**和**GPU 端事件**不存在。
**非 Triton 核心**(即 aten 核心或自定義 op)也可能偶爾出現在 trace 中。有時,Inductor 會回退到原始 op 實現,在這種情況下,您會看到對 aten op 的呼叫。
啟動開銷#
一個常見的問題是 GPU 利用率不高。快速識別此問題的方法是檢查 GPU 上核心之間是否存在大間隙。
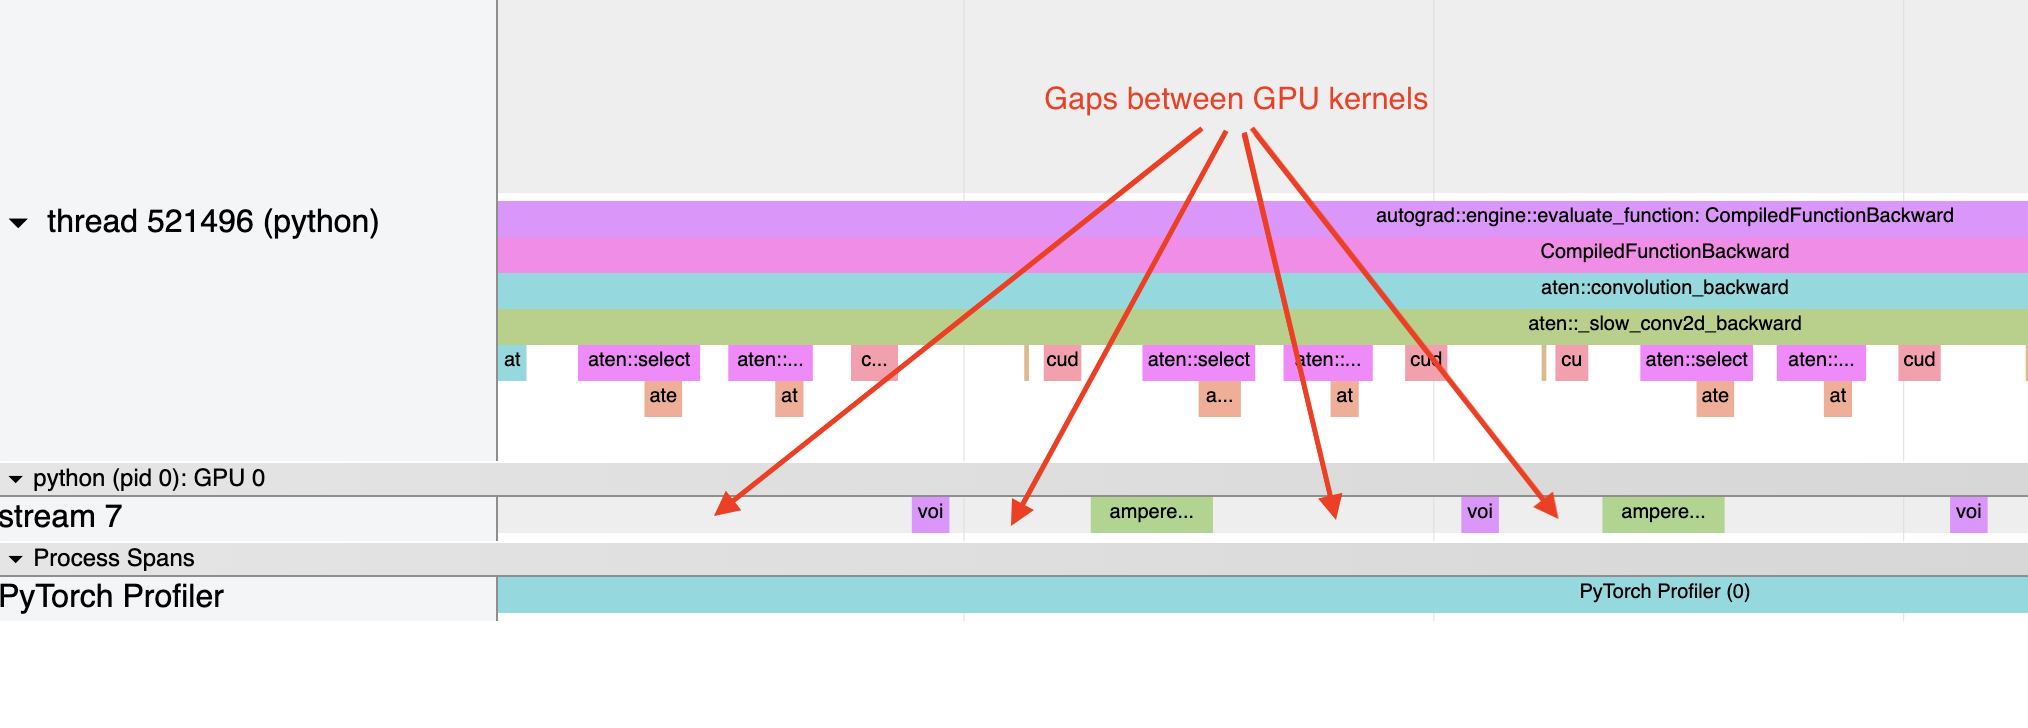
這通常是 CPU 開銷的結果,例如,如果核心啟動之間在 CPU 上花費的時間大於 GPU 處理核心所需的時間。對於小批次大小,這個問題更常見。
在使用 Inductor 時,啟用 CUDA 圖通常有助於在啟動開銷是問題時提高效能。
