torch.meshgrid#
- torch.meshgrid(*tensors, indexing=None)[原始碼]#
建立由 attr:tensors 中一維輸入指定的座標網格。
這在您想視覺化某些輸入範圍的資料時很有幫助。有關繪圖示例,請參閱下文。
給定 個 1D 張量 作為輸入,其對應的尺寸為 ,則會建立 個 N 維張量 ,每個張量的形狀為 ,其中輸出 是透過將 擴充套件到結果形狀而建立的。
注意
0D 輸入被視為與單元素 1D 輸入等效。
警告
torch.meshgrid(*tensors) 目前的行為與呼叫 numpy.meshgrid(*arrays, indexing=’ij’) 相同。
未來 torch.meshgrid 將預設過渡到 indexing=’xy’。
pytorch/pytorch#50276 跟蹤此問題,目標是遷移到 NumPy 的行為。
另請參閱
torch.cartesian_prod()具有相同的效果,但它將資料收集到張量向量中。- 引數
- 返回
如果輸入包含 個尺寸為 的張量,則輸出也將包含 個張量,其中每個張量的大小為 。
- 返回型別
seq (Tensors 序列)
示例
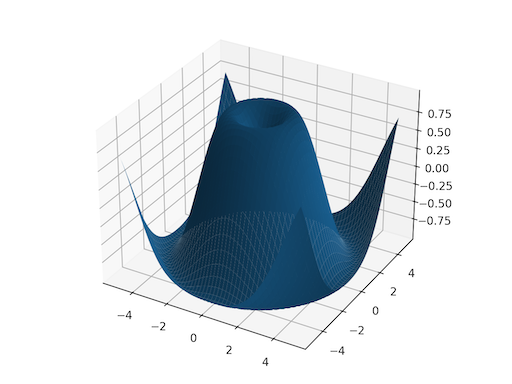
>>> x = torch.tensor([1, 2, 3])
>>> y = torch.tensor([4, 5, 6])

Observe the element-wise pairings across the grid, (1, 4),
(1, 5), ..., (3, 6). This is the same thing as the
cartesian product.
>>> grid_x, grid_y = torch.meshgrid(x, y, indexing='ij')
>>> grid_x
tensor([[1, 1, 1],
        [2, 2, 2],
        [3, 3, 3]])
>>> grid_y
tensor([[4, 5, 6],
        [4, 5, 6],
        [4, 5, 6]])

This correspondence can be seen when these grids are
stacked properly.
>>> torch.equal(torch.cat(tuple(torch.dstack([grid_x, grid_y]))),
...             torch.cartesian_prod(x, y))
True

`torch.meshgrid` is commonly used to produce a grid for
plotting.
>>> import matplotlib.pyplot as plt
>>> xs = torch.linspace(-5, 5, steps=100)
>>> ys = torch.linspace(-5, 5, steps=100)
>>> x, y = torch.meshgrid(xs, ys, indexing='xy')
>>> z = torch.sin(torch.sqrt(x * x + y * y))
>>> ax = plt.axes(projection='3d')
>>> ax.plot_surface(x.numpy(), y.numpy(), z.numpy())
>>> plt.show()